Insights / Kurdistan · Kurdamir
Kurdamir, a concept check before FEED
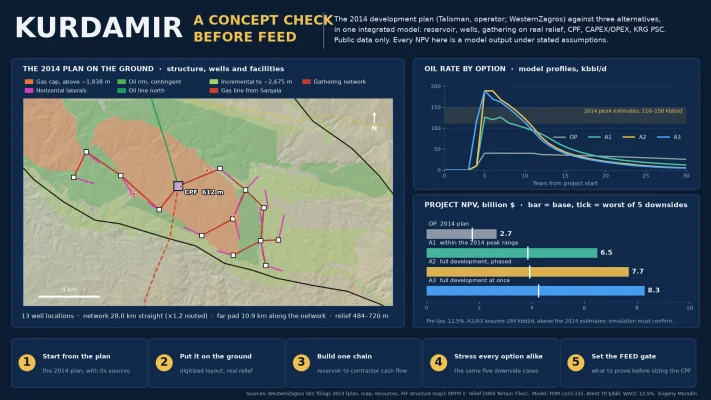
A concept check of the 2014 Kurdamir development plan on public data. The CPF, not the reservoir, limits the plan; a larger phased concept adds 3.8 billion $ of modelled NPV.
The 2014 Kurdamir plan was a reasonable start. My model says it left most of the field's value on the table.
Most concept reviews start from a blank page. The more useful ones start from the plan already on the table, because that is what a board compares against.
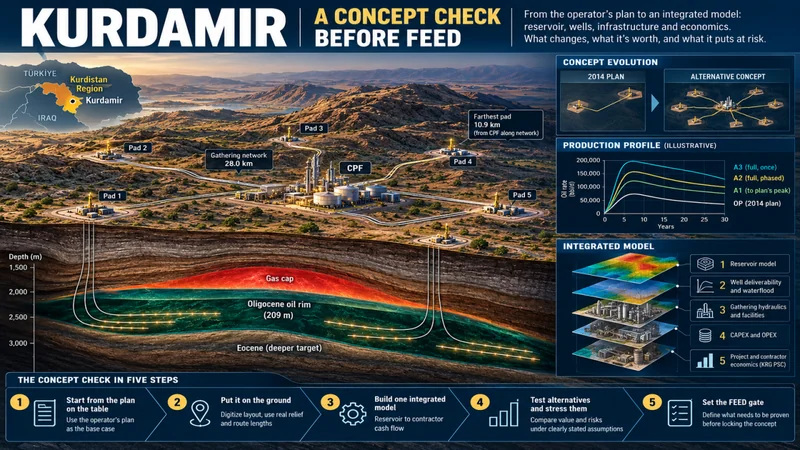
I took Kurdamir in the Kurdistan Region of Iraq and ran a concept check on public data only. The base case is not mine: it is the development plan that the operator, Talisman, and its partner WesternZagros submitted to the KRG on 31 August 2014, as disclosed in WesternZagros' SEC filings. The question was whether a better concept exists, what it is worth under clearly stated assumptions, and what it puts at risk.
Every NPV below is an output of my own integrated model. None of it is an operator, partner or audited figure.
The field and the plan
Kurdamir is an Oligocene oil rim under a large gas cap, discovered in 2010–2012. In 2014 WesternZagros reported mean gross unrisked contingent resources (not reserves) of 750 MMboe in the Oligocene and 976 MMboe with the Eocene (SEC exhibit).
The 2014 plan is phased: an early production facility (EPF) of 10,000 bbl/d based on the horizontal Kurdamir-4 well, with first oil expected in late 2015, then a CPF bringing total oil capacity to 25,000–40,000 bbl/d in early 2017, with about 15 horizontal producers on single- and double-well locations (SEC 6-K, slides 6–7). WesternZagros' 2014 filings gave management estimates of peak production of 125,000–150,000 bbl/d (September presentation and annual information form) and 110,000–150,000 bbl/d (October prospectus), both based on 2C resources in the Oligocene and Eocene. These are estimates, not demonstrated rates. In November 2014 the KRG asked for changes to the plan and work on the block was deferred (SEC exhibit 2.17); what was asked is not public.
In May 2025 the KRG signed the Topkhana–Kurdamir block with WesternZagros (Rudaw); Baghdad challenged the KRG's deals, and KRI pipeline exports to Ceyhan restarted only in September 2025 (Rudaw). Any renewed development concept has to deal with these commercial, legal and export constraints from the start.
Putting the plan on the ground
A concept check usually draws the gathering network as a circle around the CPF. I digitized the plan's layout map instead, georeferenced from the UTM grid on its frame: 13 well locations, 28.0 km of network, the far pad 10.9 km from the CPF along the network. Ground levels come from SRTM relief, which is good to about ±16 m vertically: the CPF sits at 612 m against a 614 m rotary table reported for the neighbouring K-1 well. That is a consistency check, not a survey. The pads sit between 519 and 713 m.
Against an abstract two-pad layout, the digitized 13-location layout adds 189 million $ of CAPEX and reduces project NPV by 186 million $. It did not change the ranking of any option. It did expose a model defect, which I come back to below.
What the check found
Every option is a full recalculation of one integrated Excel model: reservoir, wells, waterflood, gathering hydraulics, CPF, CAPEX and OPEX from quantities and unit rates, the KRG model PSC.
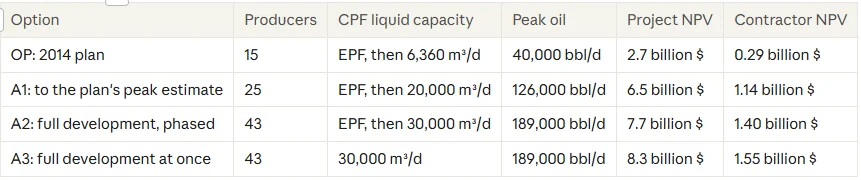
Model outputs; pre-tax project NPV at 12.5%, Brent 70 $/bbl. OP uses the upper end of the plan, 40,000 bbl/d, and a one-year EPF-to-CPF lag. In A2 and A3 the CPF runs at its oil limit.
- The plant limits the plan, not the reservoir. In the plan's sensitivities, oil price and CAPEX drive the range; STOIIP moves NPV by only about 0.25 billion $ either way, because a 40,000 bbl/d plant caps production whatever the reservoir holds. At that rate 18% of the modelled oil would come after the 30-year PSC term.
- The robust uplift is the first 3.8 billion $. A1, at 126,000 bbl/d, sits within both published 2014 peak ranges and adds 3.8 billion $ of modelled project NPV. A2 and A3 add up to 5.6 billion $, but they assume 189,000 bbl/d, above both ranges. That is the first number a reservoir simulation model has to confirm or kill.
- The ranking holds under the same downside cases. I ran every option through the same five downside cases. In each one, every alternative stays above the 2014 plan under the same assumption:
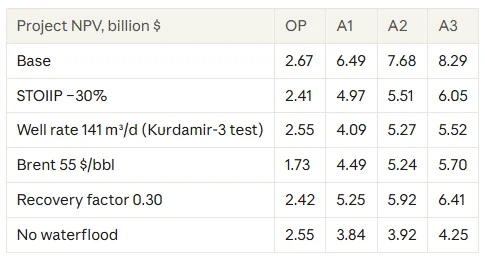
- Phasing is worth paying for. A2 gives up 0.6 billion $ against building the CPF at once. That buys sizing the CPF on real horizontal-well tests, and less capital exposed in the first year to a contested contract and an export route that was shut for 30 months.
- The contractor's view is thinner than the project's. Under the indicative KRG model PSC, the 2014 plan gives the contractor 0.29 billion $ in the base case and 0.03 billion $ at Brent 55. In a combined downside range built from the one-at-a-time sensitivities, contractor NPV falls to about −0.12 billion $: in that case the modelled economics do not cover a 12.5% cost of capital. That range is a sensitivity envelope, not a probabilistic P90.
- Pads of four wells add 0.1 to 0.3 billion $ to every option, if 3D seismic confirms the 2 km reach the trajectories need.
What I would take into FEED
Target full development, phased (A2), with four-well pads: about 8.0 billion $ of modelled project NPV, if the reservoir can sustain 189,000 bbl/d. Set a CPF FID gate: at least three horizontal wells sustaining 1,100 m³/d, GOR at or below 250 m³/m³ at controlled drawdown, a confirmed export route, and a simulation model that supports the peak rate. If the wells or the model disappoint, fall back to A1, which stays within the published 2014 peak ranges and between 3.8 and 6.5 billion $ in every tested case. Gas coning in a 209 m oil rim under a 313 m gas column is a risk to test in that simulation; a spreadsheet cannot see it.
What this taught me
The first run on the real relief went through without an error. Looking at the pipe sizes, the far-pad flowline came out at DN 426 for two wells. The model had a rule: pick the smallest pipe that keeps the wellhead below the pressure class, and if none does, take the largest. The static head of the design pad had eaten the pressure budget, no pipe passed, and the fallback hid it. That was a defect in my model, not in the 2014 plan. The fix was one formula: take the static head off the budget before splitting it between collector and flowline. The answer: DN 159, far pad at 3.4 MPa.
The second error was also mine. I first scaled the plan's map from its scale bar and read the grid labels by eye. Overlaying the structure map later did not line up, so I went back to the tick marks on the map frame: 21 pixels per km, not 22, and an anchor 8 pixels off. Every network length was 4.8% short.
Both are the same failure class as a gas-cap error I found in an earlier version of this model: a plausible number nobody would challenge. Since then every selection in the model that has a fallback must say when it used it.
The method, in five steps
- Start from the plan on the table, with its source. It is what the decision will be compared against.
- Put it on the ground. Digitize the layout, take the relief, and let pad count, route lengths and static head come from them.
- Build one chain, reservoir to contractor cash flow, so a change in one system reaches NPV through all the others.
- Map the alternatives and run the strong ones together. CPF size only has an optimum once well count and well type are fixed.
- Stress every alternative under the same cases, and list what the model cannot see.
This takes two to three weeks with a small team. Compared with a FEED budget, it is cheap insurance against freezing the wrong concept.
Your experience
Have you reviewed a development plan that was technically sound but sized well below what the field could carry? What made the case for changing it?
I run concept checks before FEED (FEL1–FEL2, Pre-FEED) for operators and EPC contractors. If you want this check on your field, write to [email protected].
Calculation note
- Model: FDM v152.131, one integrated Excel model; Brent 70 $/bbl less KRI differential and tariff, gas 60 $/thousand m³, WACC 12.5%, KRG model PSC with a 30-year development period. All NPVs are model outputs under these assumptions.
- Production = MIN(well deliverability, CPF liquid / oil / water limits, remaining reserves); water cut from a 20-layer Stiles model normalised to the recovery factor at the water-cut limit. This is a screening tank model, not a reservoir simulation.
- Field inputs from WesternZagros' 2014 SEC filings: mid oil-column depth 2,560 m, initial pressure 25.4 MPa, bubble point 24.7 MPa, GOR 186 m³/m³, 38° API, STOIIP 209 million m³.
- Layout digitized from the development-plan map using the UTM grid ticks on its frame. The image scale is about 21 pixels/km (about 48 m per image pixel); the first georeference had an 8-pixel (about 380 m) anchor error and was corrected. Coordinates and route lengths are screening-level estimates, not surveyed positions. Routes are straight-line distances × 1.2; relief is SRTM 1 arc-second (about 30 m grid, stated absolute vertical accuracy 16 m at 90% confidence), which does not remove the georeferencing uncertainty of the map. Injectors, absent from the map, sit on producer pads.
- Downside cases: STOIIP 146 million m³ (−30%, assumption), deviated-well rate 141 m³/d (Kurdamir-3 test), Brent 55, recovery factor 0.30, no waterflood (natural depletion). Each is run for every option.
- Downside / upside envelope (2014 plan only) = base ∓ √(sum of squared one-at-a-time downsides / upsides) over seven inputs treated as independent: Brent 55 / 85 $/bbl, CAPEX ×0.75 / ×1.40, OPEX ×0.80 / ×1.30, time to first oil 3 / 5 years, STOIIP 146 / 346 million m³, recovery factor 0.30 / 0.45, deviated-well rate 141 / 548 m³/d. Waterflood is a concept choice, so the no-waterflood case is in the stress table but not in the envelope. The envelope is not a probabilistic P90/P10 in the PRMS sense.
Sources
- WesternZagros corporate presentation, 8 September 2014 (SEC 6-K)
- WesternZagros prospectus, 7 October 2014 (SEC F-7/A): peak production estimate 110,000–150,000 bbl/d, EPF late 2015, CPF early 2017
- WesternZagros material change report, 4 November 2014 (SEC F-7/A, Ex. 2.17)
- WesternZagros Annual Information Form 2013 (SEC F-7)
- SEC exhibit EX-2.10, Kurdamir contingent resources, 2014
- SRTM 1 arc-second elevation, AWS Terrain Tiles
- KRG announces major agreements with US companies, Rudaw, May 2025
- KRG's US energy deals spark fresh dispute with Baghdad, Iraq Business News, May 2025
- Kurdish oil exports to resume Saturday morning, Rudaw, September 2025