Insights / Framework · Brownfield
The Production Profile Is a Shopping Cart
The profile in the corporate plan is a procurement plan for physical capacity. Each barrel has to be bought as water handling, compression, separation or power.
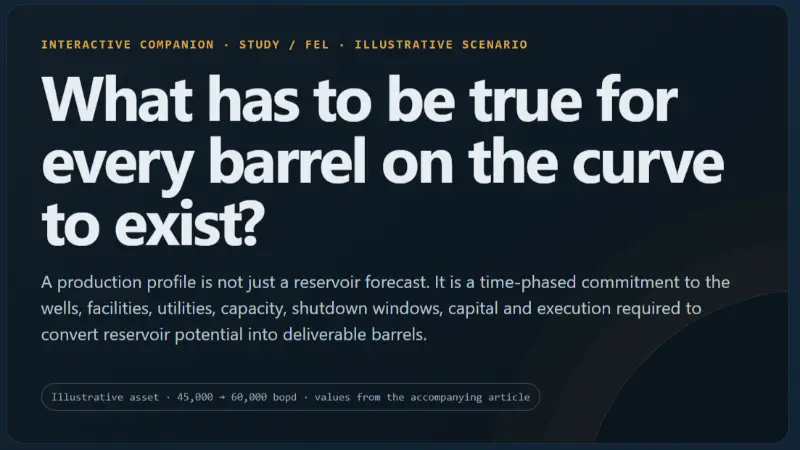
Every asset has one number that two groups read in exactly opposite ways.
Shareholders read the production profile as area under a curve and how fast the curve climbs. Operations read the same profile as what they will have to physically hold, every day, for the next twenty years.
The concept engineer sits between them. In most cases, one side gets quietly sacrificed.
Sacrifice the shareholders, and the profile does not clear the gate. Sacrifice operations, and the profile is approved - then two years later actual output sits fifteen percent below plan, nobody can quite explain why, and the person holding the loss is the one running the asset, who never had a vote on the number.
This is not a project-level problem. It is a business-planning problem. And it is worth being precise about what kind of problem it actually is.
The profile is an order, not a forecast
The profile that matters here is not the one attached to a single project sanction. It is the asset production profile that goes into the corporate plan - five, ten, twenty years - the number that feeds the budget model and the board report.
That number is not a calculation. It is an order.
Think of it the way you would think about buying parts online to upgrade a car. Every increment of production is an item in the cart. Each item has a price. Each has a delivery time. And the delivery times are not the same: one part arrives in three months, another in three years. Some are in stock. Some are made to order. Some are not on the market at all, and you only find that out after you have paid.
Well work is one price and one lead time. Debottlenecking a separation train is a different price and a different lead time. New water-handling capacity is a third. Gas compression is a fourth. Export debottlenecking is a fifth.
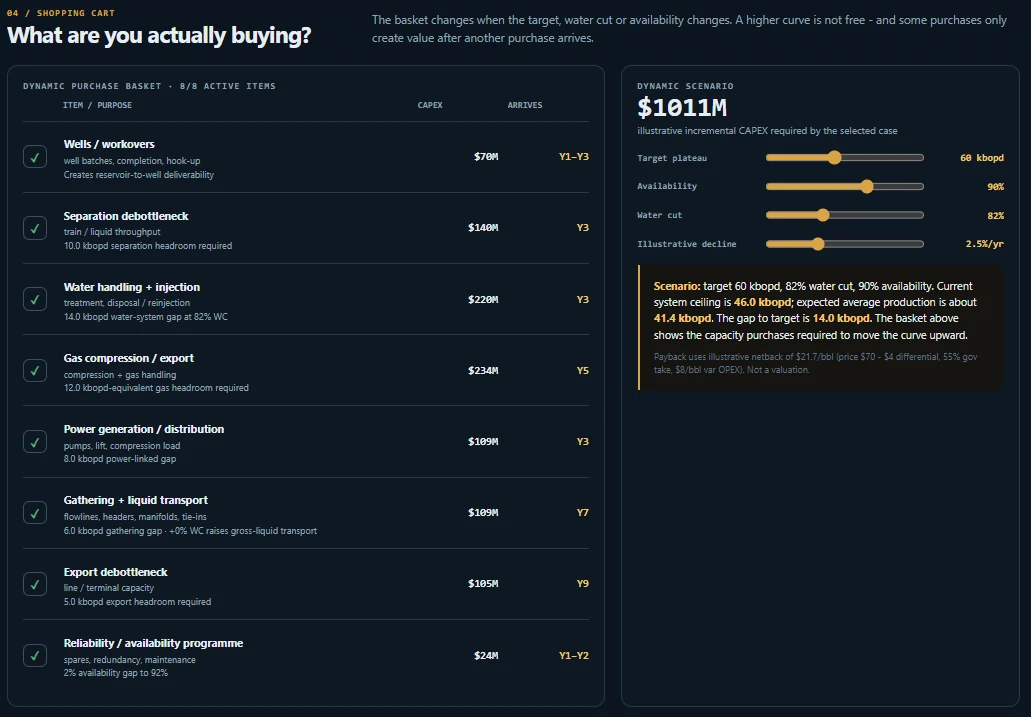
The profile that lands in the business plan is the sum of all these purchases, laid on a timeline. If a single line item is delayed, or costs more than the model assumed, the profile is no longer the one that was approved. It just takes two years for that to become visible.
The mistake is treating the profile as an output of the subsurface model. It is not. It is a procurement plan for capacity, drawn as a curve.
A worked example: the asset that promised 60 and delivered 46
Let me make this concrete with a single asset carried through the whole article. The numbers are illustrative but built from published industry benchmarks, not invented. They are also the exact numbers behind the interactive model linked at the end - the article and the tool describe the same system, link for link.
The asset. A mature onshore waterflood. Current production 45,000 bopd. Field-wide water cut 82% and rising - well within the 80-95% range typical of mature waterfloods in Western Siberia and comparable basins. Associated gas produced with the oil. The reservoir team confirms there is enough remaining recoverable oil and injection support to lift gross liquids substantially. The redevelopment case proposes a climb to a 60,000 bopd plateau.
The profile as submitted. Reservoir potential supports 60,000 bopd. Wells can be drilled and worked over to deliver it. The subsurface curve ramps smoothly from 45,000 to 60,000 over 30 months, holds plateau, then declines.
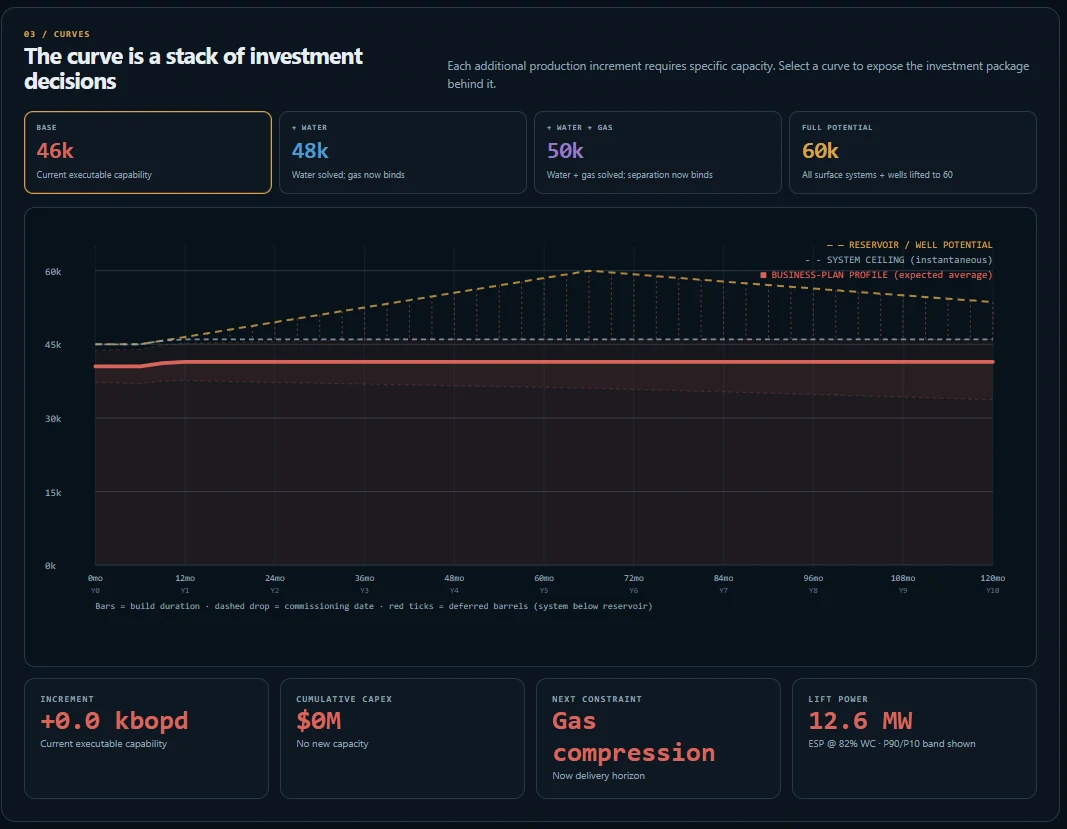
The profile as it will actually be produced. At 82% water cut, the surface systems do not clear 60,000 bopd of oil. They clear 46,000. The gap is not conservatism. It is a physical ceiling set by a specific piece of equipment, and the whole point of the exercise is to name which one.
The chain, link by link - and why each link moves differently
Reservoir potential is not delivered directly. It passes through a chain of systems, and the profile is set by the narrowest link in that chain, not by the reservoir. What matters - and what most screening models get wrong - is that the links do not all respond to water cut the same way. Each has its own physics.
Reservoir. 60,000 bopd of potential. This defines the opportunity. It is not the forecast. Every barrel between this number and reality has to be explained by a link below.
Wells and rig. The current well stock delivers about 56,000 bopd. Wells produce whatever the reservoir gives them; they are not sensitive to water cut in the way surface equipment is. Beyond 56,000 the asset needs new wells and rig time - a purchase with an 18-month lead time before the first incremental barrel.
Separation. A separator is sized for total liquid, not oil. Its oil ceiling is gross-liquid capacity multiplied by the oil fraction: Q_oil = Q_liquid x (1 - WC). At 82% water cut a train sized for roughly 278,000 blpd of liquid clears about 50,000 bopd. Push water cut to 88% and the same steel clears less oil, because more of every barrel through it is water.
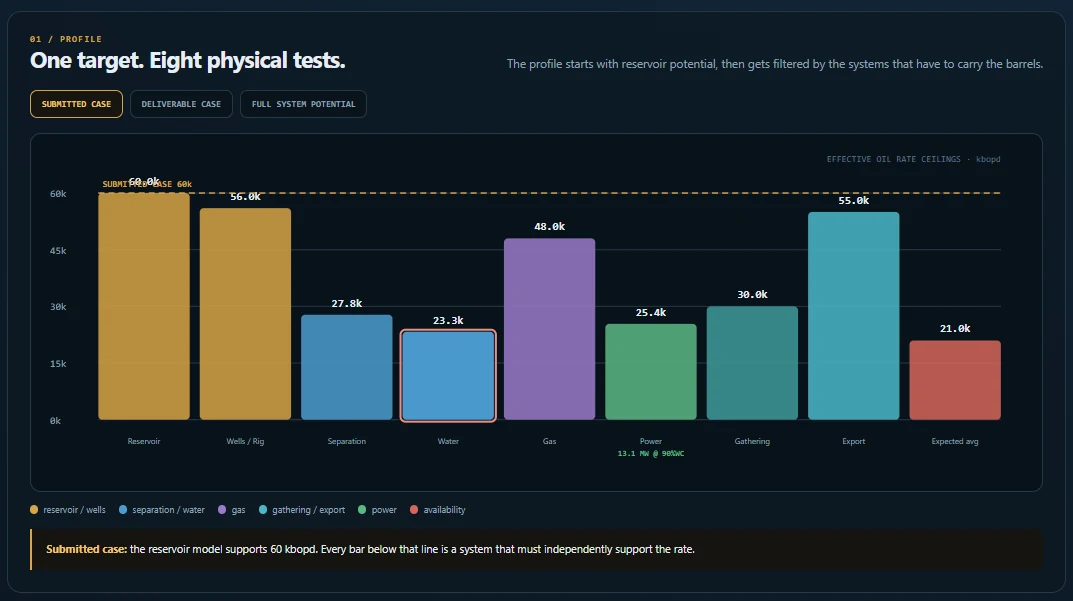
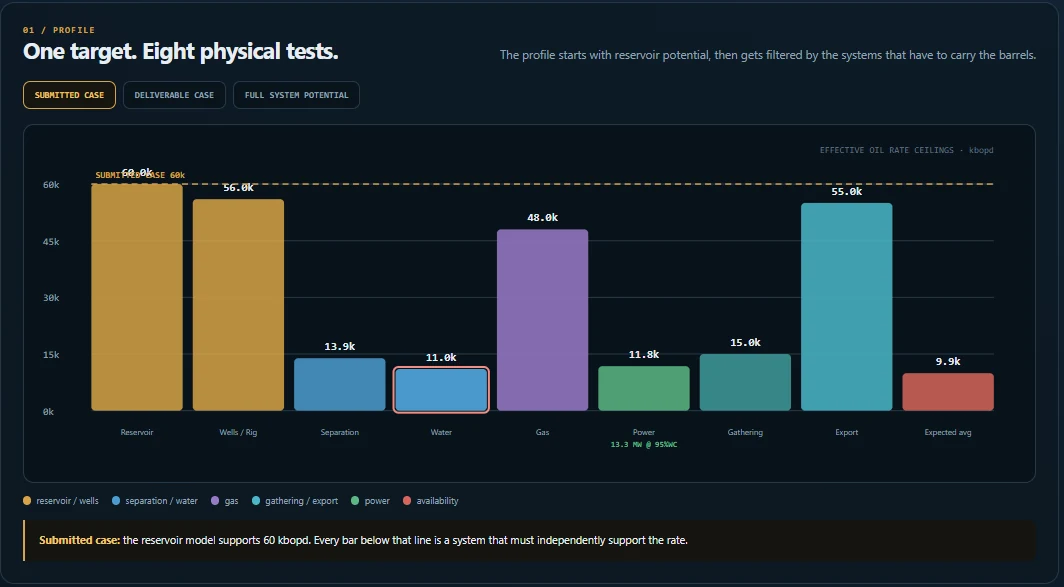
Water handling. This is the link that behaves most violently, and it is the one most screening models underestimate. Produced-water handling is sized in barrels of water, and the oil it supports follows Q_oil = Q_water x (1 - WC) / WC. At 82% water cut, a water plant rated near 210,000 bwpd supports 46,000 bopd of oil. That is the binding constraint on this asset today. Now move water cut, and watch the number collapse: at 90% the same plant supports about 23,000 bopd; at 95%, about 11,000. The water system did not shrink. The oil it can carry did, because each barrel of oil now arrives with far more water attached. This is the non-linearity that turns a comfortable margin into a crisis inside three years of rising water cut.
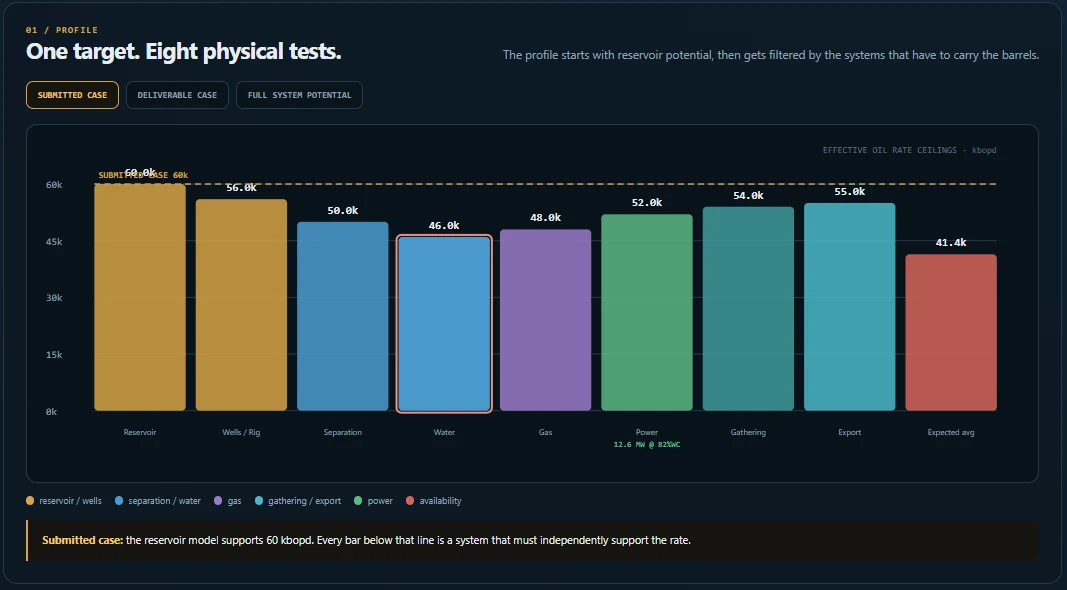
Gas compression. Associated gas tracks the oil rate, not the water. On this asset gas handling caps oil near 48,000 bopd. It is independent of water cut - the constraint that appears the moment water is solved. (The model treats gas as a fixed illustrative capacity; gas-oil ratio is not simulated.)
Power and artificial lift. This is where an error hides in most Excel screening models, and it is worth stating plainly because it inverts a common assumption. As water cut rises, lifting energy does not fall - it rises, and steeply. The pump has to lift the full gross-liquid stream, Q_liquid = Q_oil / (1 - WC), and as reservoir pressure declines it has to add more head to do it. Both effects push electrical demand up. A model that lets lifting power drift down over field life because it is quietly tracking reservoir pressure has the sign backwards. On this asset the installed power supports about 52,000 bopd of oil at 82% water cut - and that oil ceiling falls as water cut climbs, because the same megawatts now lift more water per barrel of oil. Power is not a static line. It is a constraint that tightens exactly when the reservoir team is most optimistic about gross liquids.
Gathering. Between the wells and the plant sits the flowline, header and manifold network, sized for the original well count and layout. Like separation, it carries gross liquid, so its oil ceiling is Q_oil = Q_flowline x (1 - WC). Here it caps oil near 54,000 bopd - not binding today, but a wall that moves closer every time water cut rises or wells are added.
Export. The export pipeline carries dry oil after separation, so it is not sensitive to water cut. It caps throughput near 55,000 bopd. Producible is not the same as exportable, but on this asset export is not the first wall.
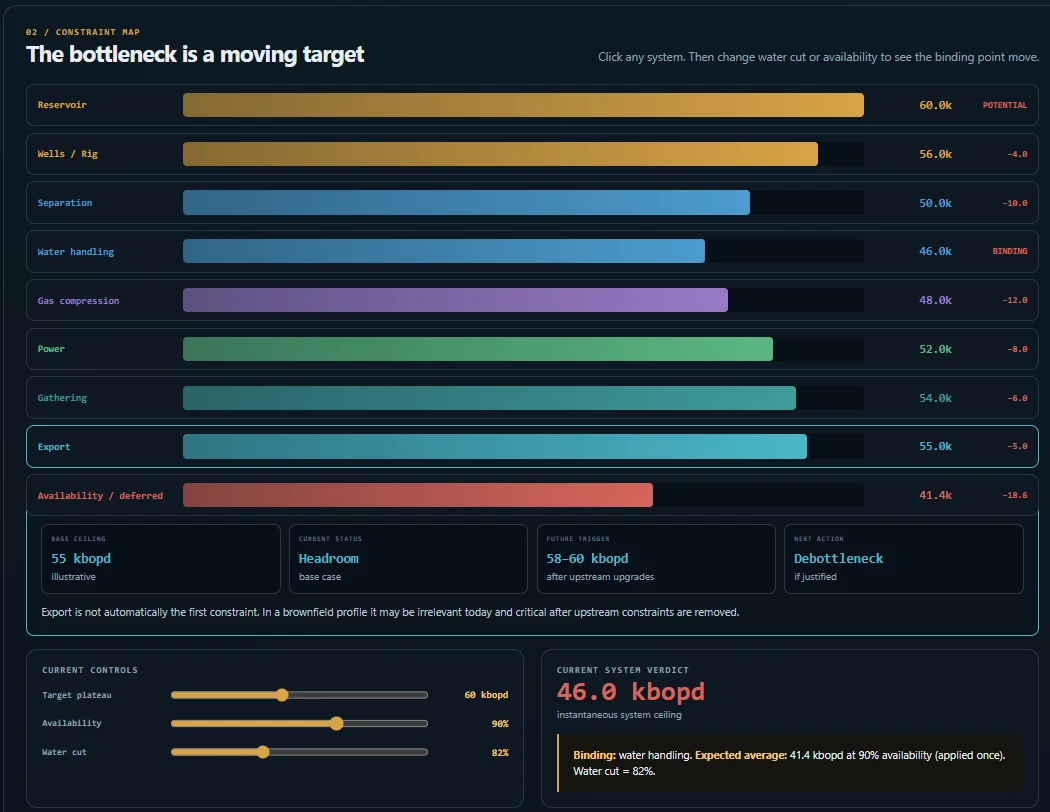
Line the chain up at today's 82% water cut:
Reservoir 60 -> Wells 56 -> Separation 50 -> Water 46 -> Gas 48 -> Power 52 -> Gathering 54 -> Export 55
Removing a constraint does not create capacity. It exposes the next one.
Here is the part that separates a business plan from a wish. When you buy your way past the binding constraint, the profile does not jump to the reservoir potential. It rises to the next-narrowest link - and stops there.
And the purchase is not "buy 6,000 barrels." You cannot buy oil rate. You buy a physical thing - water-treatment capacity, a compressor, megawatts, flowline - and the oil rate is whatever the physics then allows at the prevailing water cut. This distinction is not academic. It is the difference between a model that respects reality and one that assigns numbers.
Start at the base: water binds at 46,000 bopd.
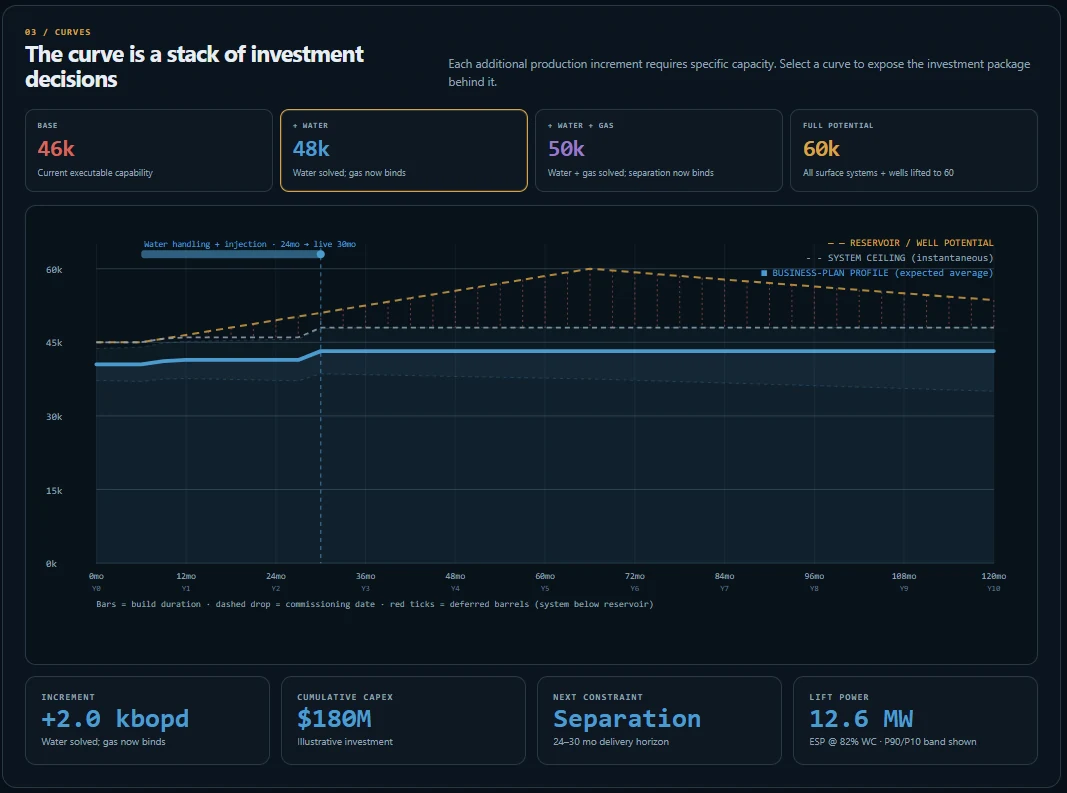
Buy water handling. Expand produced-water capacity so that, at the reference water cut, the water link clears 52,000 bopd. Note what was actually purchased: not "52,000 barrels of oil," but additional barrels-of-water capacity. Recompute the chain and the profile does not reach 52,000 - it stops at 48,000, because gas compression is now the binding link. The water investment did exactly what it was supposed to. It just handed the constraint to gas. Price the water package, put a commissioning date on it, and the curve steps up - to the gas ceiling, not to the reservoir.
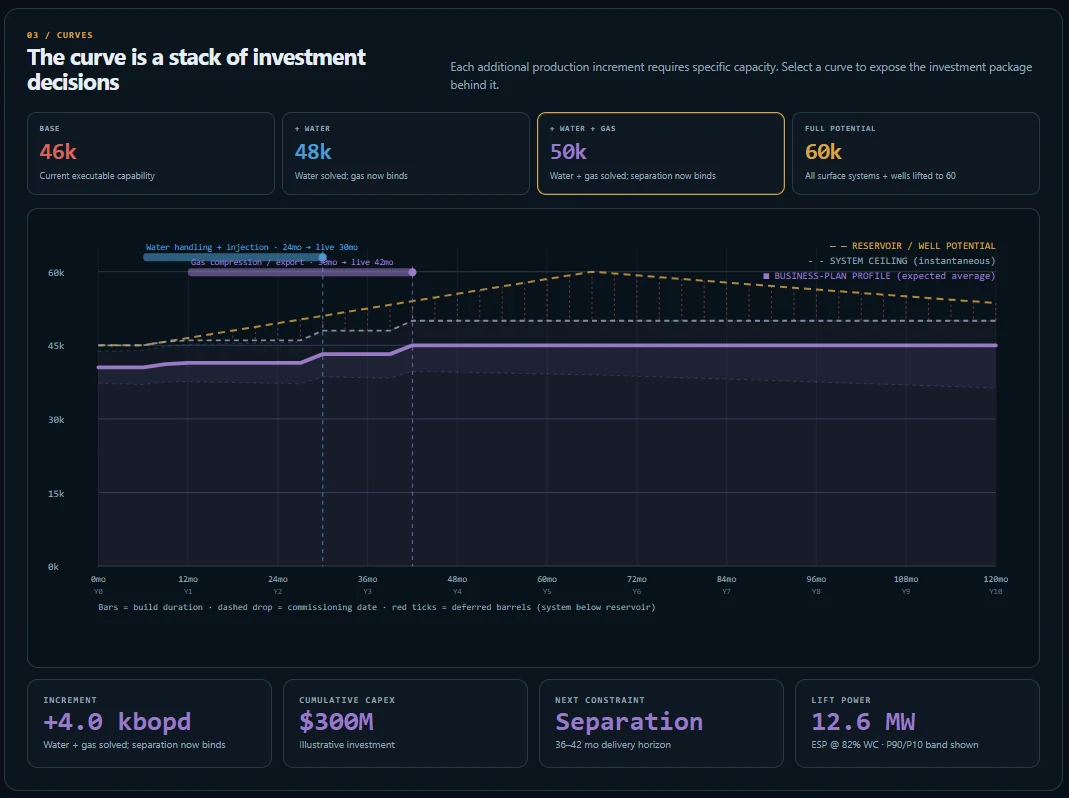
Buy gas compression as well. Now oil can rise until it meets separation at 50,000, or - as water cut keeps climbing - until the water plant you just expanded becomes binding again at the higher water cut. Every solved constraint reveals the next, and rising water cut can hand a constraint back to a system you already paid to expand.
Buy the full package. Water, gas, separation, power, gathering and export all lifted, plus a rig campaign for the wells. Only now does the profile approach 60,000 - and only if water cut cooperates. Six purchases, six lead times, six commissioning dates. Miss any one and the plateau is set by whatever did not arrive.
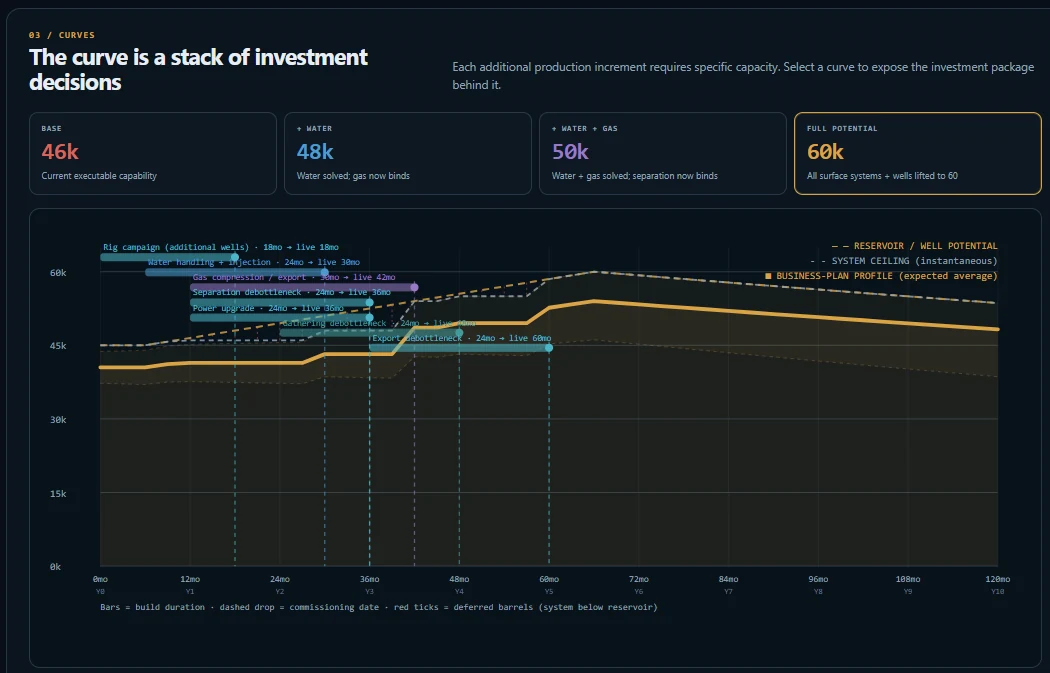
This is the migration of the binding constraint, and it is the single most important thing a production profile has to show. A profile that names one constraint for a twenty-year plan and stops has not been engineered. It has been asserted.
Deferred production is a line, not a haircut
There is a second place profiles quietly lie: the availability factor.
The instantaneous system ceiling - what the plant clears on a good day - is not what the asset averages over a year. The difference is deferred production: turnarounds, unplanned mechanical downtime, well interventions, external and commercial curtailment. The lazy move is to fold all of that into a single availability percentage and multiply the curve by it.
The problem is that one number hides four different management problems with four different owners. Planned turnarounds belong to operations and are schedulable. Unplanned mechanical downtime belongs to maintenance and reliability. Interventions belong to the subsurface and wells team. Commercial curtailment belongs to marketing and export. Rolled into a single factor, none of them has an owner, and none of them can be improved, because nobody can see their own share.
Split by cause, deferred production becomes a management target. Move the balance between planned and unplanned downtime and you are describing a maintenance philosophy, not reading a constant. The barrels are the same barrels the availability factor would have removed - the point is to show them by cause, with an owner against each, rather than burying them in one percentage that hides the double-count between a shutdown and the constraint it was already accounting for.
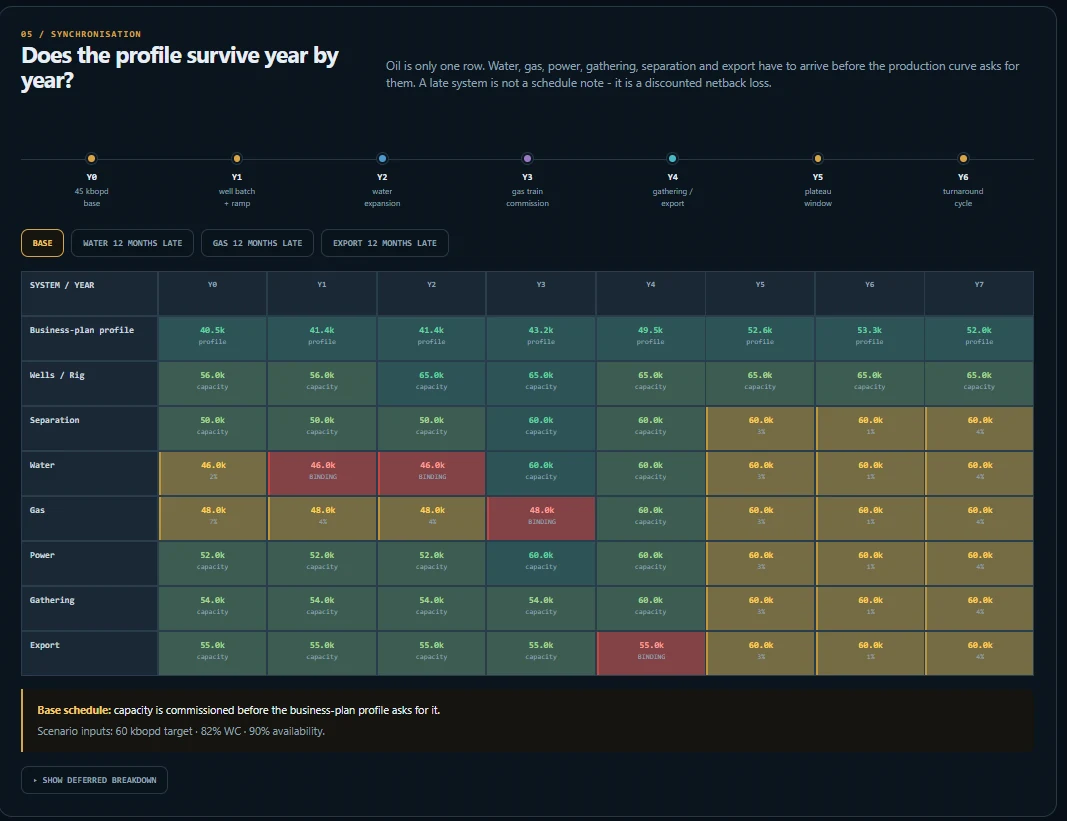
Synchronisation, and the cost of a late system
The last test is the hardest, because it is where most plans pass on paper and fail in the field.
For every year of the profile, do water, gas, power, gathering, separation, wells and export all support the stated oil rate? Or does one subsystem arrive after the oil curve has already asked for its capacity?
A late system is not a schedule note to be logged in a risk register. It is a barrel that does not get produced, and a barrel that does not get produced on time is money. The economics are not complicated, but they have to be stated in the currency the investment committee actually uses, which is cash flow, not revenue. A deferred barrel is worth its netback, not its price: oil price minus differential, minus government take, minus the variable operating cost you avoid by not producing it. On this asset, at an illustrative $70 oil price, a $4 differential, 55% government take and $8 per barrel of variable operating cost, the netback is about $22 per barrel - not $70. Multiply the deferred barrels by that netback, discount them back to today, and a "twelve-month slip on gas compression" stops being a schedule risk and becomes a number the board can weigh against the cost of protecting the schedule.
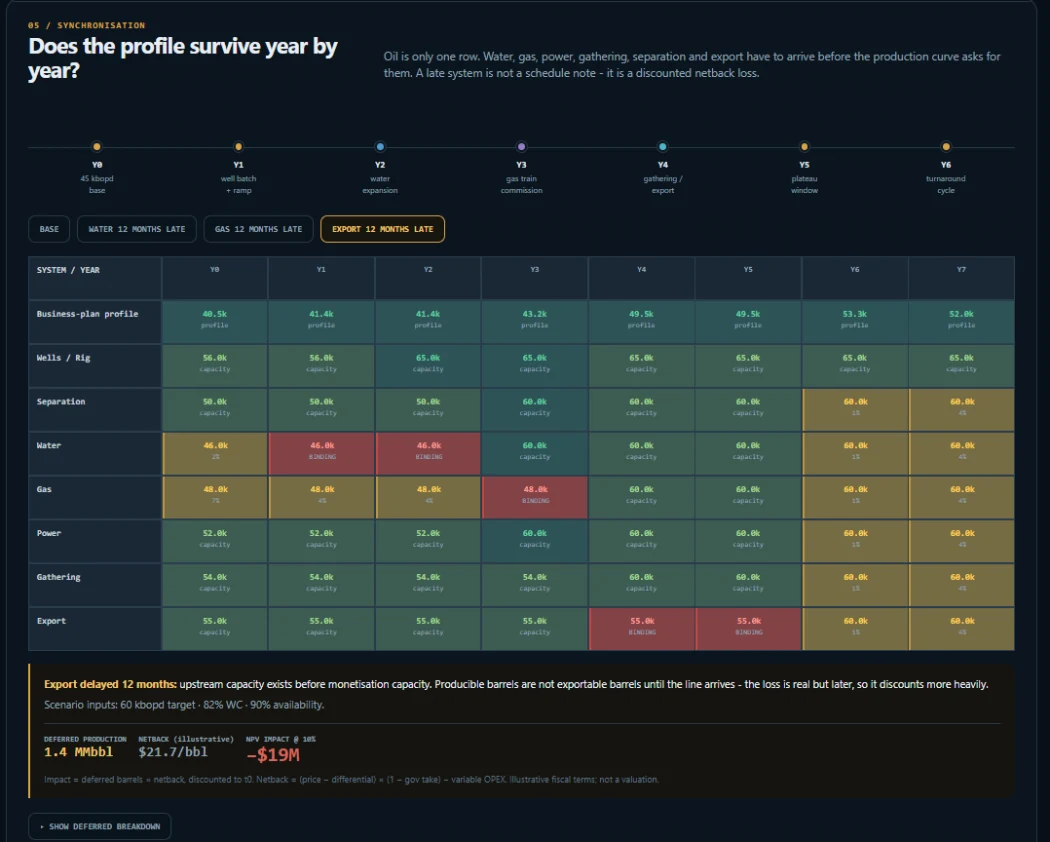
And the cost of a slip depends entirely on whether the late system was on the critical path. Delay the water plant while gas is the binding constraint and the profile barely moves - the delay is nearly free, because the system you slipped was not the one setting the ceiling. Delay gas when gas is binding and the loss is real and immediate. This is why "cost of delay" cannot be a flat contingency. It is specific to which constraint is binding in which year - which is exactly what the constraint chain, built correctly, tells you.
What this means for the number in the corporate plan
The production profile is not a subsurface deliverable that the surface team decorates. It is a procurement plan for physical capacity, drawn as a curve, and it is only as honest as the six things behind it:
A conversion baseline built from measured uptime and spare capacity, not a nameplate assumption. A binding constraint identified as a sequence, not a single number. Execution windows - turnarounds, tie-ins, interventions - placed on the timeline before any curve is drawn. Every upward step tied to a named purchase, its physical capacity, its cost and its commissioning date. Deferred production shown as its own line, split by cause and owner. And a synchronisation check that proves, year by year, that every supporting system arrives before the oil curve needs it - with the cost of any slip stated in discounted netback.
Do that, and the two groups who read the profile in opposite directions are finally reading the same number. The shareholders get a curve that clears the gate because it is real. Operations get a plan they can physically hold, because every constraint was named and priced before the number went into the book.
Miss any one of the six, and the profile is not a plan. It is an order nobody checked the stock for.
Evgeny Maradin - Concept Development / FEL, Upstream Oil & Gas - [email protected]
#UpstreamOilAndGas #FEL #ConceptEngineering #ProductionEngineering #BrownfieldDevelopment